Methodology
Read More About the Data and Methods Used to Develop the Supply Model.
Background
The American Board of Pediatrics (ABP) certifies physicians in 15 pediatric subspecialties. Subspecialty certification aims to assure that infants, children, adolescents, and young adults (hereafter, "children") have access to high-quality, equitable pediatric subspecialty care.
In 2019, the ABP Foundation initiated a project to estimate the future supply of pediatric subspecialists in the United States (US). The Program on Health Workforce Research and Policy at the University of North Carolina Chapel Hill's Cecil G. Sheps Center for Health Services Research (Sheps Center) and Strategic Modelling and Analysis Ltd. (SMAP) developed a microsimulation model forecasting the future supply of 14 pediatric subspecialities at the national and subnational level from 2020-2040 with funding and collaboration from the ABP Foundation. Pediatric hospital medicine, the newest ABP pediatric subspecialty, was not included in the model due to the lack of available historical data.
Model Basics
Workforce supply models are useful tools to help policy makers understand how many health workers we will have in the future. In this project, the Sheps Center and SMAP developed a microsimulation model using historical, deidentified, individual-level data to forecast the supply of physicians in 14 pediatric subspecialties certified by the ABP. The forecasts are available at the national level and at the Census region and division levels as shown in the Figure below.

Projections by Headcount or Clinical Workforce Equivalent
Supply forecasts are available in both headcount (HC) and clinical workforce equivalent (CWE), which is the headcount adjusted to account for the proportion of time spent in direct clinical or consultative care.
To calculate CWE, data from the American Board of Pediatrics (ABP) Maintenance of Certification (MOC) surveys were employed. These surveys ask how many hours, on average, a respondent worked per week in the past six months. They also ask a physician to report the proportion of time spent in six areas, with the amount of time across all areas totaling 100%. Those six areas include (1) administration, (2) direct and/or consultative inpatient and outpatient care, including patient billing and charting (with or without trainees), (3) medical education, (4) quality improvement activities, (5) research, and (6) others. Using these two questions, each subspecialist's hours spent in clinical care were calculated by multiplying the total hours worked by their self-reported proportion of time in direct and/or consultative care.
Projections Per Capita
To account for differences in population in different geographies, the supply model provides not only HC and CWE but also the ratio of pediatric subspecialists per 100,000 child population for HC and CWE. By selecting the "Subspecialists per 100,000 Children" option in the model's online visualization, users can display supply per 100,000 child population in different geographic regions through 2040. The population estimates were derived from the University of Virginia Weldon Cooper Center, Demographics Research Group. The Cooper Center's forecasts have proven to be accurate at the national level (only a 0.33% difference between their projection and the actual 2020 U.S. Census Bureau) and state level. Our model used the 2020, 2030, and 2040 forecasts to interpolate the population in the years between these forecasts.
It is important to note that although the age of the child population served by different subspecialties (e.g. neonatal-perinatal medicine and adolescent medicine) varies, the model uses the same denominator (100,000 children 0-18 years) for all 14 subspecialties. Using the same age range for all subspecialities allows users to compare supply projections between subspecialties.
Figure 1 shows projections for the child population 0-18 years from 2020-2040.
Figure 1. Child Population Forecast by U.S. Census Region: 2020-2040
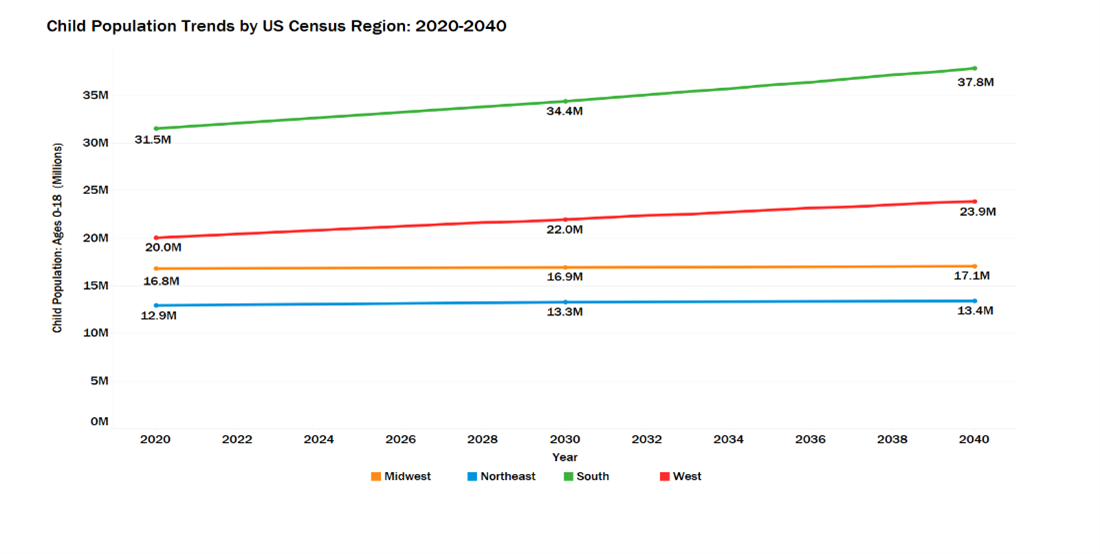
Data based on projections from the University of Virginia Weldon Cooper Center, Demographics Research Group. (2018). National Population Projections. Retrieved from https://demographics.coopercenter.org/national-population-projections
Model Conceptual Framework
The model, conceptualized in Figure 2 estimates future pediatric subspecialist workforce supply by taking the number of subspecialists in the current workforce and:
adding the supply of fellows completing training (held constant at 2019 levels),
subtracting pediatric subspecialists who exit the clinical care workforce ("leavers"); physicians are assumed to retire after age 70.
accounting for the geographic movement of fellows from their training program to their first practice location and the movement of the existing workforce between different regions throughout their career,
adding subspecialists who worked outside the US and returned to provide clinical care ("out-of-country returners"),
adjusting headcount to account for self-reported proportion of time spent in clinical care based on Maintenance of Certification (MOC) survey data responses for current pediatric subspecialists.
Figure 2. Conceptual Framework for the Pediatric Subspecialty Workforce Model
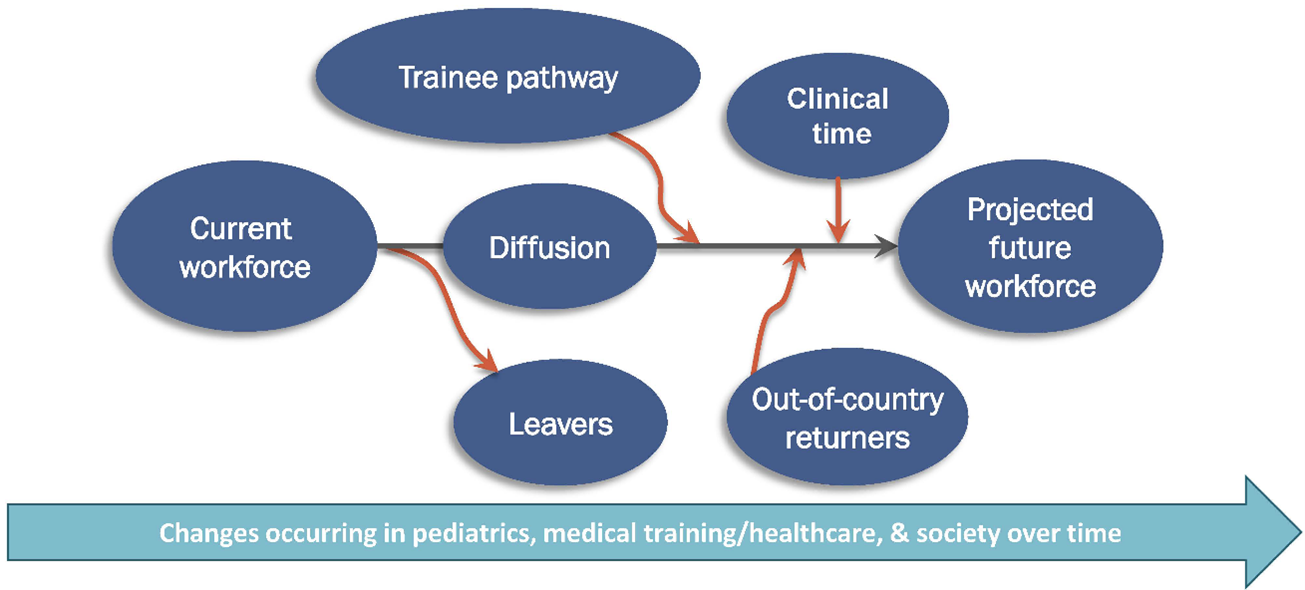
Figure 2 is adapted from Fraher E, Knapton A. Chapter 13: Workforce planning in a rapidly changing healthcare system. Planning in a rapidly changing healthcare system. In C.J. Sampson, B.J Fried (Ed.). Human Resources in Healthcare. 5th ed. Health Administration Press; 2021:429-456.
How the Model Works
The microsimulation model creates physicians at Year 0 of the model based on the characteristics of pediatric subspecialists in the ABP's 2020 data. Then, for each simulated year, individual-level probabilities were calculated based on historical data and applied to physicians to forecast their likelihood of entering or exiting the workforce, increasing or decreasing their clinical time, and moving between geographic regions. A "run" of a physician through the model represents the comparison of a computer-generated, random probability and the reference probability drawn from historical datasets. Individual physician data was "run" through the model for 100 iterations then aggregated to generate the mean supply forecast and confidence intervals (95%) around supply estimates that account for uncertainty.
For example, an individual in the model has a particular probability of moving from one geographic region to another after fellowship. That probability is estimated based on past histories of previous individuals of that age, gender, location, and subspecialty. As the individual is run through the model 100 times, some of those runs produce different geographical movements. This technique is applied from training through retirement. The average of these runs is taken, and then all averages are aggregated per subspecialty nationally and at the U.S. Census Bureau region and division.
Data: Sample and Sources
Sample
Subspecialists in 14 of the 15 pediatric subspecialities certified by ABP are represented in the model, including:
Adolescent Medicine
Pediatric Cardiology
Child Abuse Pediatrics
Pediatric Critical Care Medicine
Developmental-Behavioral Pediatrics
Pediatric Emergency Medicine
Pediatric Endocrinology
Pediatric Gastroenterology
Pediatric Hematology-Oncology
Pediatric Infectious Diseases
Neonatal-Perinatal Medicine
Pediatric Nephrology
Pediatric Pulmonology
Pediatric Rheumatology
Pediatric hospital medicine was not included as it was only recently instituted at the ABP (2019), and thus had less available data, particularly regarding fellowship numbers. Several other subspecialty certifications (e.g., sports medicine) are available through the ABP but were not included since they are administered by other boards.
The following clinicians were excluded from the model:
Physicians without active or permanent certification in at least one of the 14 subspecialties of interest
Physicians with unknown ages or physicians ≥70 years, as the ABP does not have data regarding retirement age
Physicians with non-US or US Territory mailing addresses, as the model focused on the US workforce supply
Non-certified pediatric subspecialists who once held a pediatric certification but are not currently certified with the ABP
Other clinicians (general pediatricians, adult physicians, advanced practice providers) who may see children for subspecialty care but are not certified with the ABP
Sources
Five data sources were used in the model:
The 2020 ABP Certification Management System (CMS), which contains demographic and certification information for all pediatric subspecialists certified within the ABP
Data from the American Board of Internal Medicine (ABIM) and American Board of Family Medicine (ABFM) which contains data on physicians with certification in adolescent medicine
Data from The American Board of Emergency Medicine (ABEM) which contains data on physicians with certification in pediatric emergency medicine
The ABP Maintenance of Certification (MOC) Enrollment Survey data set that captures subspecialists' self-reported work characteristics
University of Virginia Weldon Cooper Center for Public Service data, which provided population projections for children 0-18 years using available U.S. Census Bureau data through 2040
Table 1 summarizes the variables taken from the ABP data sets to develop the model.
Table 1. Physician Variables from ABP Data Sources Used in the Model
| Characteristic | How Used in the Model |
|---|---|
| Practice and Training Location | Modeling current supply by region and movement between geographies post-training and during physician's career |
| Age | Workforce exit & percent time in clinical care varies by age |
| Gender | Workforce exit & percent time in clinical care varies by gender |
| Certification Data | Type & date of current certification |
| Race & Ethnicity | Not displayed in the current model but able to be added in the future as ABP data become more complete |
| Clinical Time | Self-reported proportion of time spent in direct and/or consultative inpatient and outpatient care, including patient billing and charting (with or without trainees). Used to calculate clinical workforce equivalent (CWE) which is headcount adjusted for hours worked and proportion of time spent in clinical care |
| Average Number of Hours Worked per Week over the Last 6 Months | Used as denominator for calculation of CWE |
"What If" Scenarios
Workforce models produce a forecast based on historical data; however, workforce participation patterns, models of care, training programs, the economy, world-wide pandemics, and other factors will inevitably alter workforce trends. To account for these potential, but unknown changes, workforce modelers often create "what if" scenarios that allow users to explore alternative outcomes to the baseline model. Scenarios allow users to alter the assumptions used in the baseline scenario regarding the inflow of new entrants to the workforce, time spent in clinical care and workforce exit. Table 2 describes the 10 scenarios modeled.
Table 2. Alternative Scenarios Included in the Model
| Scenario | Operationalization |
|---|---|
| Increase and Decrease in Fellows | 1. Permanent increase in fellows by 5% 2. Temporary decrease in fellows by 2% |
3. Increase in fellows by 12.5% by 2030 4. Decrease in fellows by 12.5% by 2030 | |
| Increase and Decrease in Proportion of Time in Clinical Care | 5. Increase in clinical hours starting in 2022 with 1% increase each year until a 7% increase is reached in 2028, which becomes permanent |
| 6. 7% reduction in clinical hours worked, starting in 2022 with a 1% reduction per year, until it reaches a 7% reduction in 2028, which becomes permanent | |
| Early Retirement/Attrition | 7. Everyone exits the workforce 5 years earlier than baseline, implemented for years 2021 to 2023, and then the exit rate returns to the historical rate due to a temporary crisis or event (e.g., COVID-19 pandemic). |
| 8. Increased level of exit in mid-career models a temporary (5-year duration) 12.5% increased probability exit for mid-career (in practice for 10-20 years) subspecialists starting in 2021 | |
| Combination of Factors Decreasing and Increasing Supply | 9. Early exit by 5 years, 12.5% decrease in fellows, 7% reduction in clinical hours worked |
| 10. 12.5% permanent increase in fellows, 7% increase in clinical hours worked |
Interpreting Model Outputs
Interpreting a projection model is not always intuitive. Model forecasts are displayed as lines that connect yearly supply projections. In this model, each point on a line represents the aggregation of 100 microsimulation runs for each subspecialty at that point in time based on probabilities associated with the workforce behaviors described above. The shading around each line shows the 95% confidence interval for each estimate, indicating the model's level of uncertainty.
When interpreting forecast model outputs, it is generally helpful to assess:
directionality of its outputs across time (increase, decrease, no change) and,
the magnitude of change between model outputs at two or more points of time.
Directionality
The line displaying supply projections may trend positive, negative, or somewhat flat over the projection period. In this way, the model provides different subspecialties with a supply forecast that estimates whether the size of their workforce will increase, decrease, or remain relatively stable between 2020 and 2040. The size as measured by headcount of the workforce in any given year is a function of the number of subspecialists in the workforce in the previous year, the number of new entrants in that year (graduating fellows, actively practicing subspecialists who move to that geographic area and out-of-country returners) and the number who exit the workforce (retire or leave clinical practice) in that year. Headcount is then adjusted to account for the proportion of time spent in direct clinical or consultative care to calculate CWE.
Magnitude
The interactive visualization allows users to compare differences in headcount or CWE between subspecialties or across different geographic regions. For example, users may want to compare projected supply in their subspecialty to other subspecialties. Alternatively, model users may want to compare differences in supply projections for a specific subspecialty, such as Child Abuse Pediatrics subspecialists, between geographic regions.
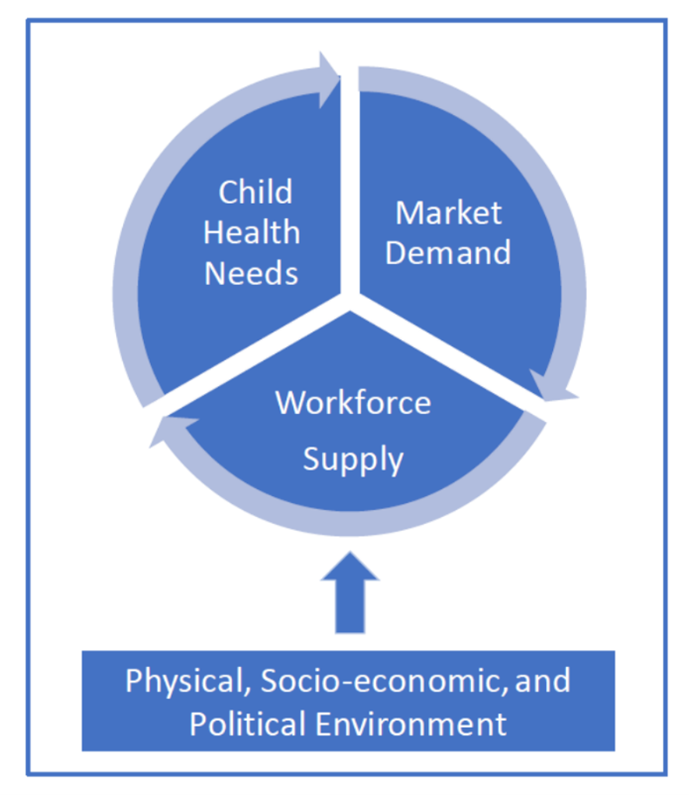
A large projected growth in supply doesn't necessarily mean oversupply, and a smaller projected supply growth doesn't necessarily indicate undersupply. Supply must always be considered within the context of child health need, market demands (e.g., how many positions the market will support), and environmental factors (Figure 4).
Figure 3. Four Domains for Pediatric Subspecialty Care
Model Contributions
This model addresses limitations of previous pediatric subspecialty models by:
forecasting the supply of the 14 subspecialties individually instead of aggregated together
forecasting supply for individual pediatric subspecialties at national and subnational levels
accounting for workforce demographics, practice characteristics, and the geographic movement of trainees and the existing workforce in each subspecialty
projecting absolute numbers or HC and CWE, which is HC adjusted for self-reported time spent in direct or indirect clinical care
accounting for the growth and geographic distribution of US children 0-18 years by incorporating forecasted data from the University of Virginia Weldon Cooper Center, Demographics Research Group that used U.S. Census Bureau data to calculate its future child population estimates
Model Limitations
As with most forecasts, the model results are imperfect and are our "best guess" based on available data and knowledge. The future supply of subspecialists may not fall within the confidence intervals if workforce behaviors deviate significantly from past trends (i.e., burnout results in increased workforce attrition rates) or if actions are taken in response to the model findings (i.e., a pediatric subspecialty increases or decreases the number of fellows in training). Microsimulation models, as with all models, must strive to be parsimonious and focused on key variables for which there are good data. Incorporating additional variables, especially those for which data are not complete, makes the model more complex, and has the potential to introduce error with no real gains in forecast reliability.
The model has several limitations:
- The model is based on historic workforce trends and behavior, all from the pre-COVID-19
period, to estimate the future, which will inevitably differ from the present in some way.
- The alternative scenarios provide some means of estimating potential futures but do not capture all possible futures.
- The model focuses on the supply of 14 pediatric subspecialties certified by the ABP and excludes other clinicians (e.g., other physicians, advanced practice providers) who provide care for children needing pediatric subspecialty care.
- Administrative data used in the model may not accurately capture the supply of pediatric
subspecialists in practice in the US because:
- Estimates of geographic mobility are based on addresses that may not be regularly updated by subspecialists.
- The model relies on survey data on hours worked and clinical time and survey data may suffer from response bias.
- The model does not provide estimates at the state or county level due to small sample sizes. State and county-level data are available from the ABP.
- The model focuses only on clinical care and does not address the supply of pediatric subspecialists who lead medical education, quality improvement, research workforce efforts, and scientific discovery.
Finding Out More
For more information on the methods employed in the model, we recommend reading this article describing the model's methodology, Forecasting the Future Supply of Pediatric Subspecialists in the United States: 2020-2040, published as part of a 19-article supplement to the journal, Pediatrics. This supplement also includes manuscripts outlining findings for each of the 15 subspecialties and recommendations for education and training, practice, policy, and future workforce research.